Why it matters to you
LIA depends on many services: AI models, a database, your mailbox, your calendar, a search engine. Each one can fail quietly. The search provider answers slowly, a task queue gets stuck, a backup fails one night. If nobody sees it, you're the one who finds out, at the wrong moment, in the form of an empty answer or a reminder that never arrives.
I wanted the person who runs an instance to see these problems before their users do, to be able to trace them back to their cause, and to read numbers that tell the truth.
Three ways of looking
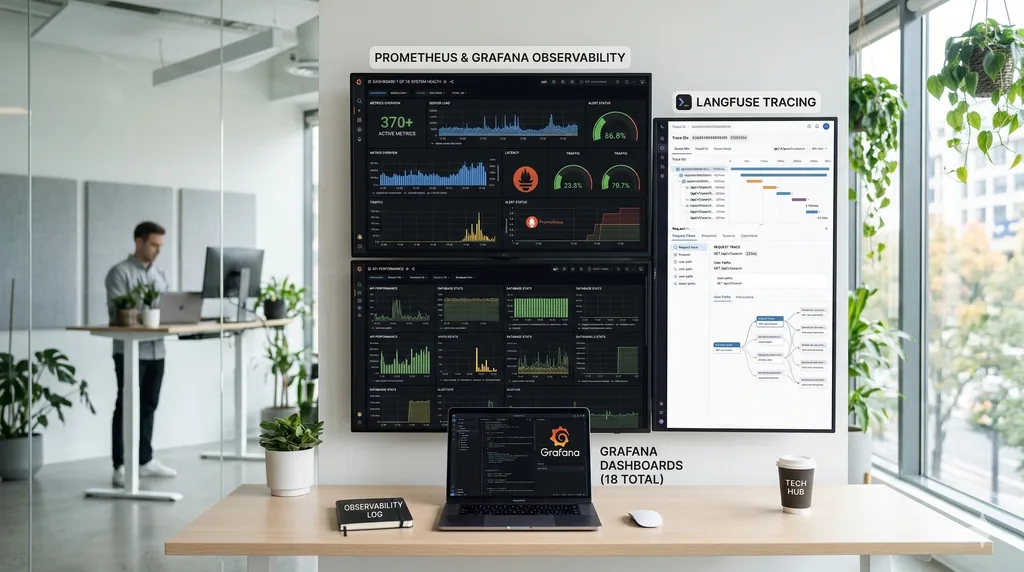
- Metrics: hundreds of counters track requests, model calls, tokens consumed, costs, connectors or voice. About thirty dashboards make them readable.
- Logs: each event is written in a structured form and gathered in one place. Logs carry facts, like numbers, identifiers or error codes; people's words don't go into them.
- Traces: a trace follows a request from end to end, step by step. If the operator turns it on, a tool dedicated to AI models, Langfuse, also tracks each call: the model used, the tokens, the response time, the cost.
These signals point to one another. A log line opens the trace of its request, a trace opens its logs and its metrics, a latency spike opens the exact example that caused it. Pages appear there under their shape, such as “a relationship's page”: the name or the search an address contains isn't shown.
Let's take a concrete case. An answer takes unusually long to arrive. The chat dashboard shows the rise; a click on the slowest point opens the trace of that turn; the trace shows that the wait comes from the search service, and its logs say which code it returned. Without these links, you'd have to match timestamps by hand.
Getting warned
So that the operator doesn't have to keep watching the screens, a core set of alerts is evaluated continuously and sent by email: API, database or cache unavailable, disk or memory full, server errors, answers too slow, failed backup, public address unreachable, certificate close to expiry. Each alert links to a written resolution procedure, and tests check that the threshold shown in the email is indeed the one that triggers it.
The slowness alert only looks at the turns a person is waiting for: a routine running at night keeps nobody waiting. And the chain that carries these signals is itself monitored: an alert warns you if logs get lost along the way.
LIA reads its own health
When the operator turns it on, LIA runs a regular check-up on itself: error rates, response times, model failures, disk, memory, database. Signals that describe the same failure are grouped into a single incident. A dedicated model reads the evidence collected and the procedure written for that case, then proposes a likely cause and actions. These are proposals for a person: nothing is executed. Administrators see everything on the Platform health page, with what the model read shown under each diagnosis.
For you, the effect is discreet: when a service is known to be down, LIA knows it before planning and works around it: you don't wait for a timeout to find out.
Numbers that don't lie
I also wanted these figures to be right. A tool often fails by returning a failure, without raising an error, and a counter that only watched errors would take it for a success. So a single criterion decides what counts as a success, for the registers as well as for the metrics. For search by meaning, when a call is retried, a counter says whether the caller finally got its result, so that a failure that was caught up doesn't inflate the error rate. Finally, a metric must be read by a dashboard, a rule or an alert: a new metric nobody reads fails the build, and the list of old ones still waiting to be wired can only get shorter.
The limits
All of this assumes the operator deploys the monitoring stack and sets up email sending. Without it, LIA works, but its health check-up is limited to its direct checks. An alert warns; it doesn't repair. And the most detailed log level, turned off in production, keeps more information: it's reserved for development. More details on observability, on the technical side.
Read more: Watching LIA work: the steps that show up while you wait; Tuning LIA's models without a restart, and without impossible configurations.